


Solar Analyzer

Deskripsi Solar Analyzer
Easy to use tool to calculate details essential to help a user analyze the solar energy available to them. It provides details of a graph of the daily energy profile over the course of a year as well as the total energy produced over that period, the optimum tilt angle and details to help users size a micro-grid. This app provides a unique feature in allowing a user to quantify the number of days annually on which they won't have enough energy to meet their load which is very useful for helping to size a micro-grid.
I am a student who has just graduated with a masters in sustainable energy engineering and a bachelors in physics both from the university of Nottingham. For my masters project I decided to try to create an easy to use programme that could help a user who doesn't have very much knowledge about solar energy implement a solar phototvoltaic system. The end result is this app, a relatively brief description for which is included below.
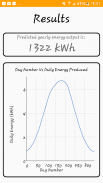
To calculate the energy output of the user's solar cells the programme performs a series of geometric calculations based on the earth's position with respect to the sun , the earth's rotation, etc... An integral is then solved over each hour of each day of the year to find the intensity of solar radiation incident on a horizontal plane from which the radiation on a plane tilted at any angle can be found. Data of the amount of cloud coverage and surface reflectivity corresponding to the user specified location is read in from NASA's 'POWER' website and used. Once the solar radiation has been calculated it is easy to find the energy produced using the area of the panels and efficiency of the cells and the inverter. This result is then presented to the user in the form of a graph of the daily energy over the course of a year and total energy produced for that year.
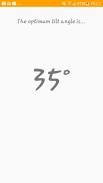
The optimum tilt angle is simply calculated by running the code described above over each tilt angle from 0 to 90 degrees and outputting the angle that corresponds to the largest annual energy generation.
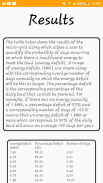
The micro-grid sizing section reads in data from the NASA website of daily insolation on a horizontal surface over a 34 year period (this is why it takes a while to run). It then restructures and performs extensive statistical analysis on the data to output a table of energy deficits and the corresponding days annually on which an energy deficit of that size or larger will occur. An energy deficit is defined as the difference between the daily load and energy produced when not enough energy is generated to meet demand. The table produced is very useful for users who are users who are trying to size a micro-grid as it allows them to see the frequency with which energy deficits occur and their extent (how much energy they will lack). Thus, size their micro-grid accordingly. This is the unique component of the app.
It is also worth noting that the NASA website from which this app extracts data is in it's beta testing phase and is sometimes unavailable in which case the app will throw an error.
Lewis O'Leary
olearylewis94@outlook.com
+44 (0)7791514094
These data were obtained from the NASA Langley Research Center POWER Project funded through the NASA Earth Science Directorate Applied Science Program.
Icons made by Vectors Market from www.flaticon.com is licensed by CC 3.0 BY
Mudah untuk menggunakan alat untuk menghitung rincian penting untuk membantu pengguna menganalisis energi surya tersedia bagi mereka. Ini memberikan rincian grafik profil energi harian selama setahun serta total energi yang dihasilkan selama periode itu, sudut kemiringan optimal dan rincian untuk membantu pengguna ukuran mikro-grid. Aplikasi ini menyediakan fitur unik dalam memungkinkan pengguna untuk mengukur jumlah hari per tahun di mana mereka tidak akan memiliki energi yang cukup untuk memenuhi beban mereka yang sangat berguna untuk membantu ukuran mikro-grid.
Saya seorang mahasiswa yang baru saja lulus dengan master di bidang teknik energi berkelanjutan dan bujangan dalam fisika baik dari universitas Nottingham. Untuk proyek master saya memutuskan untuk mencoba untuk membuat mudah untuk menggunakan program yang dapat membantu pengguna yang tidak memiliki banyak pengetahuan tentang energi surya menerapkan sistem phototvoltaic surya. Hasil akhirnya adalah aplikasi ini, penjelasan yang relatif singkat yang disertakan di bawah ini.
Untuk menghitung output energi sel surya pengguna program melakukan serangkaian perhitungan geometris berdasarkan posisi bumi terhadap matahari, rotasi bumi, dll ... Sebuah terpisahkan kemudian diselesaikan lebih setiap jam setiap hari tahun untuk menemukan intensitas kejadian radiasi matahari pada bidang horizontal dari mana radiasi pada pesawat miring di setiap sudut dapat ditemukan. Data dari jumlah cakupan awan dan reflektifitas permukaan sesuai dengan lokasi pengguna tertentu dibaca di dari website 'DAYA' NASA dan digunakan. Setelah radiasi matahari telah dihitung mudah untuk menemukan energi yang dihasilkan menggunakan area panel dan efisiensi sel-sel dan inverter. Hasil ini kemudian disajikan kepada pengguna dalam bentuk grafik dari energi harian selama energi tahun dan jumlah yang diproduksi untuk tahun itu.
Sudut kemiringan optimal hanya dihitung dengan menjalankan kode yang dijelaskan di atas satu sama sudut kemiringan 0-90 derajat dan keluaran sudut yang sesuai dengan pembangkit energi tahunan terbesar.
Mikro-grid ukuran bagian membaca data dari situs NASA insolation harian pada permukaan horizontal selama periode 34 tahun (ini adalah mengapa dibutuhkan waktu untuk menjalankan). Kemudian restrukturisasi dan melakukan analisis statistik yang luas pada data untuk output tabel defisit energi dan hari-hari yang sesuai setiap tahun di mana defisit energi sebesar itu atau lebih besar akan terjadi. Defisit energi didefinisikan sebagai perbedaan antara beban sehari-hari dan energi yang dihasilkan bila tidak cukup energi yang dihasilkan untuk memenuhi permintaan. Tabel yang dihasilkan sangat berguna bagi pengguna yang pengguna yang mencoba untuk ukuran mikro-grid karena memungkinkan mereka untuk melihat frekuensi yang terjadi defisit energi dan sejauh mana mereka (berapa banyak energi mereka akan kekurangan). Dengan demikian, ukuran mereka mikro-grid sesuai. Ini adalah komponen unik app.
Hal ini juga diperhatikan bahwa situs NASA yang aplikasi ini ekstrak data di dalamnya tahap pengujian beta dan kadang-kadang tidak tersedia dalam hal aplikasi akan melempar kesalahan.
Lewis O'Leary
olearylewis94@outlook.com
+44 (0) 7791514094
Data ini diperoleh dari Proyek DAYA NASA Langley Research Center yang didanai melalui Direktorat Program Studi Ilmu Sains Terapan NASA Earth.
Icons dibuat oleh Vektor Pasar dari www.flaticon.com dilisensikan oleh CC 3.0 BY
Solar Analyzer - Versi 8.8
(15-10-2019)
Solar Analyzer - Informasi APK
Versi APK: 8.8Paket: com.oleary.lewis.solarenergyVersi Terakhir dari Solar Analyzer


Aplikasi pada kategori yang sama


Anda juga mungkin suka...


